Zhongfang Liu 1 *, Camille Risi 2, Francis Codron 3, Guillaume Gastineau 3, Xiaohe Huan 1,Haimao Lan 1,Wanling Xu 1,GabrielJ.Bowen 4
1 State Key Laboratory of Marine Geology, Tongji University, Shanghai, China.
2 Laboratoire de Météorologie Dynamique, IPSL, CNRS, Sorbonne Université, Paris France.
3 LOCEAN, Sorbonne Université, Paris, France.
4 Department of Geology and Geophysics, University of Utah, Salt Lake City, UT, USA.
*Corresponding author.
Email: liuzf406@gmail.com
Abstract
The past four decades have witnessed a strengthening of the winter anticyclonic circulation over the Barents-Kara Sea (BKS), a change that has contributed substantially to amplified local warming and sea ice loss, as well as to Eurasian cooling. However, the cause of this trend in the BKS atmospheric circulation remains unknown. Here we show that anthropogenic greenhouse gases are the primary driver of the strengthening of the BKS anticyclonic circulation, with anthropogenic aerosols playing a secondary role, both together accounting for about 86% of the observed circulation trend. Both forcings induce an amplified BKS low- tropospheric warming through coupling with strong sea ice loss. This amplified warming raises geopotential height aloft through thermal expansion, causing an anomalous anticyclonic anomaly, which in turn enhances warming and sea ice loss, forming a positive feedback loop. Our work provides a theoretical framework for understanding Arctic atmospheric circulation responses to anthropogenic warming and may have implications for climate and environment in the Arctic and beyond.
Full Article:https://www.science.org/doi/10.1126/sciadv.ads4508
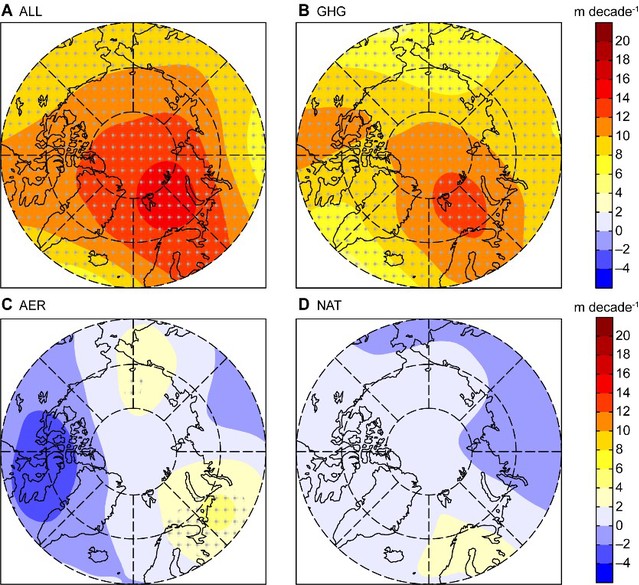
Figure. Simulated changes in winter Arctic atmospheric circulation in response to different forcings during the period 1980–2014. (A to D) Linear trends of Z300 for each type of forcing: ALL (A), GHG (B), AER (c), and NAT (d). All trends are calculated from 3- year means (with 2- year means for the period 2013–2014). the stippling shows statistical significance at the 5% level in all plots.